启动elaticsearch需要java环境,请自己谷歌搭建哈
elaticsearch
下载tar包1
wget https://artifacts.elastic.co/downloads/elasticsearch/elasticsearch-6.4.1.tar.gz
解压1
tar -zxvf elasticsearch-6.4.1.tar.gz
进入elaticsearch 可执行文件目录1
cd elasticsearch-6.4.0/bin
启动elaticsearch1
./elaticseaerch
如果没有抱任何错误,正常来说应该是可以通过restful API来访问的。1
curl -X GET "localhost:9200/_cat/health?v"
对应的返回结果1
2epoch timestamp cluster status node.total node.data shards pri relo init unassign pending_tasks max_task_wait_time active_shards_percent
1538014388 10:13:08 elasticsearch green 1 1 0 0 0 0 0 0 - 100.0%
由此我们可以认为elaticsearch已经启动成功了。
kibana
下载tar包1
https://artifacts.elastic.co/downloads/kibana/kibana-6.4.1-linux-x86_64.tar.gz
解压tar包1
tar -zxvf kibana-6.4.1-linux-x86_64.tar.gz
更改kibana配置文件1
vim /kibana-6.4.1-linux-x86_64/config/kibana.yml
添加或解注释以下内容1
2
3server.port: 5601
server.host: "localhost"
elasticsearch.url: "http://localhost:9200"
进入kibana可执行文件目录1
cd kibana-6.4.1-linux-x86_64/bin/
启动kibana
./kibana
配置成功后,用浏览器访问http://ip:5601可以看到以下页面
elaticsearc 基本操作
检查集群状态
1 | curl -X GET "localhost:9200/_cat/health?v" |
获取结果如下显示1
2epoch timestamp cluster status node.total node.data shards pri relo init unassign pending_tasks max_task_wait_time active_shards_percent
1538019385 11:36:25 data-mining green 1 1 1 1 0 0 0 0 - 100.0%
列出所有索引
1 | curl -X GET "localhost:9200/_cat/indices?v" |
如下图所示,我们只有一个索引1
2health status index uuid pri rep docs.count docs.deleted store.size pri.store.size
green open .kibana eFUOj6qJTQCt4xQdvbv8KA 1 0 1 0 4kb 4kb
创建一个自定义的索引
1 | curl -X PUT "localhost:9200/customer?pretty" |
对插入的索引返回结果1
2
3
4
5
6
{
  "acknowledged" : true,
  "shards_acknowledged" : true,
  "index" : "customer"
}
再次查看当前索引1
curl -X GET "localhost:9200/_cat/indices?v"
可以观察到多了一个名为‘customer’的新索引1
2
3health status index uuid pri rep docs.count docs.deleted store.size pri.store.size
green open .kibana eFUOj6qJTQCt4xQdvbv8KA 1 0 1 0 4kb 4kb
yellow open customer k50FrrMLScGvwzOvfiF0fg 5 1 0 0 401b 401b
插入一个文档
1 | curl -X PUT "localhost:9200/customer/_doc/1?pretty" -H 'Content-Type: application/json' -d' |
如果操作正常,那么插入成功后会返回以下结果1
2
3
4
5
6
7
8
9
10
11
12
13
14{
"_index" : "customer",
"_type" : "_doc",
"_id" : "1",
"_version" : 1,
"result" : "created",
"_shards" : {
"total" : 2,
"successful" : 1,
"failed" : 0
},
"_seq_no" : 0,
"_primary_term" : 1
}
按照_id查询索引内的文档
1 | curl -X GET "localhost:9200/customer/_doc/1?pretty" |
查看返回结果,”_index”为当前查询的索引,“_type”为查询的文档类型,“_id”为文档所在的id,
“_source”为我们要查询的内容
1 |
|
elastcisear-head
为了更方便的地查询es中的数据,我推荐使用es插件elasticsearch-head来快速检索es中的数据。
如果你使用的版本是在elasticsearch 5之后,还需要对elasticsearch 进行配置1
2
3
4cat >> elasticsearch-6.4.0/config/elasticsearch.yml << EOF
http.cors.enabled: true
http.cors.allow-origin: "*"
EOF
安装
由于elasticsearch-head 需要nodejs,所以我们需要先安装 nodejs 以及 npm
nodejs 安装
1 | sudo apt install nodejs |
nodejs 安装完后,我们就可以把elasticsearch-head 下载,进行配置了。1
2
3
4git clone git://github.com/mobz/elasticsearch-head.git
cd elasticsearch-head
npm install
npm run start
操作成功后的输出显示1
2
3
4
5
6
7
8
9 $ npm run start
> elasticsearch-head@0.0.0 start /home/ethan/ekl/elasticsearch-head
> grunt server
(node:22696) ExperimentalWarning: The http2 module is an experimental API.
Running "connect:server" (connect) task
Waiting forever...
Started connect web server on http://localhost:9100
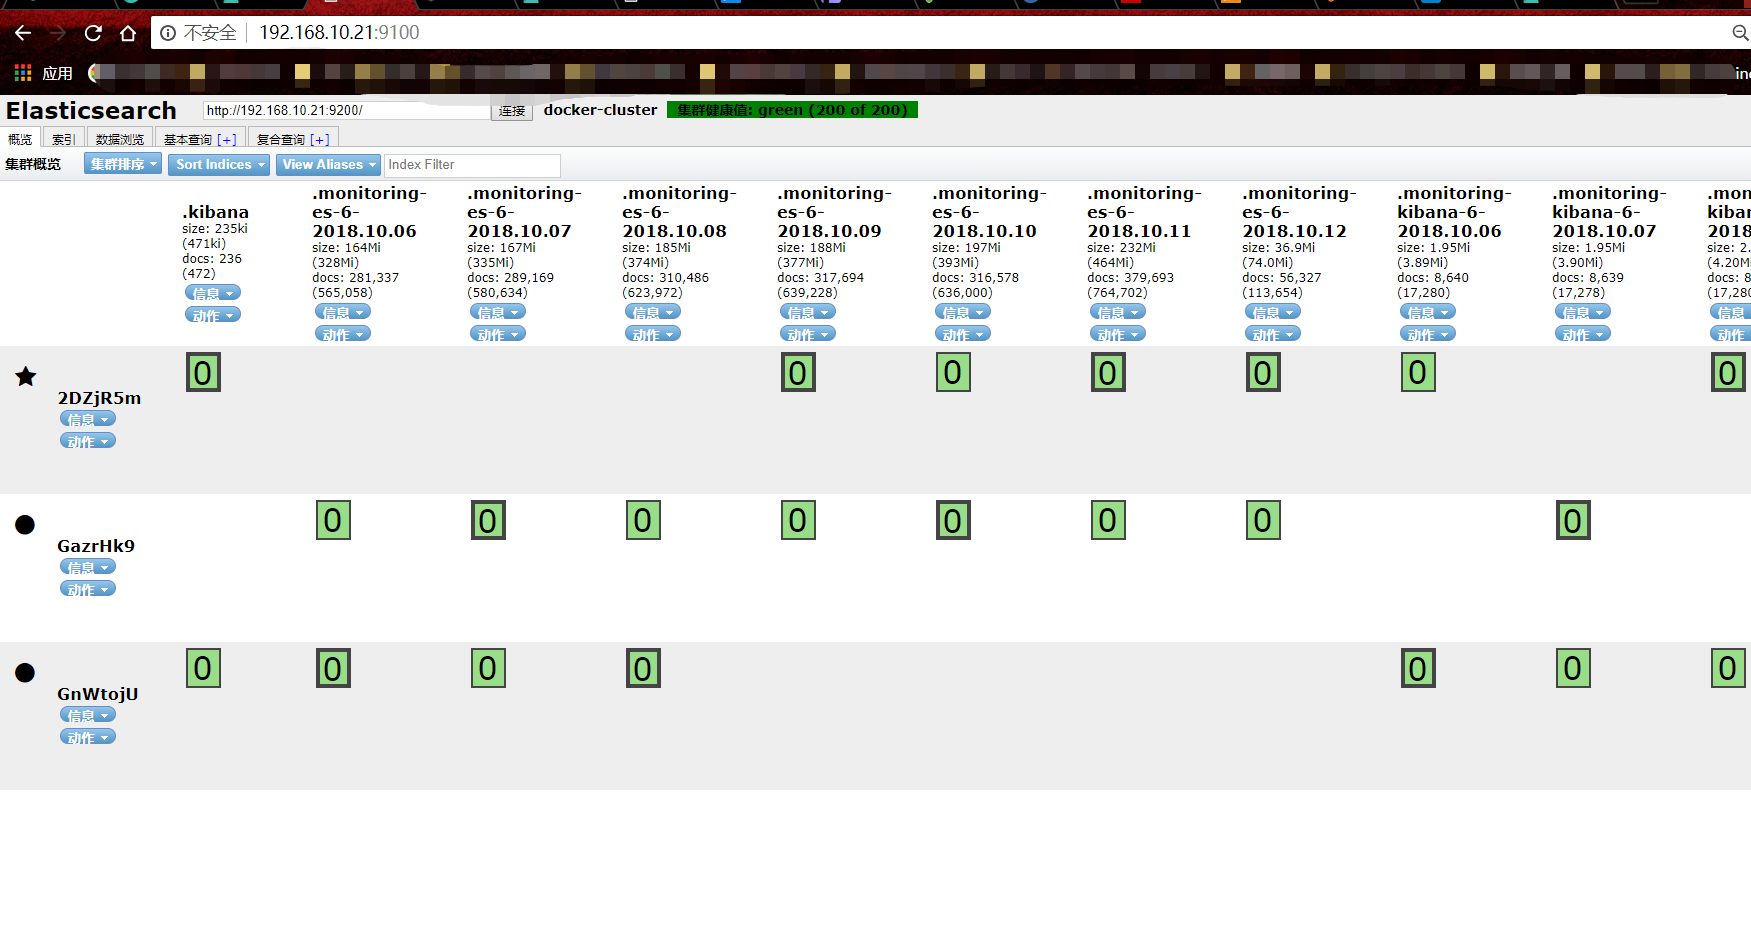
这样我们最简单的数据搜素平台就搭建成功了。